Data Completeness and the EPI
By MIT Election Lab – Jack Williams
The MIT Election Data and Science Lab manages the Elections Performance Index (EPI), an objective, nonpartisan assessment tool evaluating U.S. election administration. As we prepare the 2018 index, we are dedicating a series of posts to exploring the new data for each of the EPI indicators.
Our post today was written by Jack Williams, a Senior Research Associate at the MIT Election Lab who is working on developing the 2018 EPI.
The Elections Performance Index (EPI) aims to provide an objective snapshot of how states administer federal elections. A state can only be included in the snapshot if it makes the operation of election administration visible to the public. The most comprehensive program of election-administration transparency is the Election Administration and Voting Survey (EAVS), which is published by the U.S. Election Assistance Commission (EAC) every two years. The extent to which local jurisdictions in each state report the core data of the EAVS determines their score on the indicator we will be examining here: data completeness.
The data completeness indicator pulls information from all six sections of the EAVS: voter registration, the Uniformed and Overseas Citizens Absentee Voting Act (UOCAVA) voting, domestic absentee voting, election administration, provisional ballots, and Election Day activities. All told, it relies on 18 survey items considered so basic to election administration that all jurisdictions should be expected to report them.
The good news with data completeness in 2018 is that nearly half (24) of the states provided 100% of the data constituting these 18 items for every one of their local jurisdictions, with 35 states providing at least 99% of the required data elements. The bad news is that this is down somewhat from 2014, when 26 states were perfect; however, some stragglers from 2014 improved their reporting, so that the overall nationwide completeness rate in 2018 was virtually unchanged from 2014.
Completeness since 2008

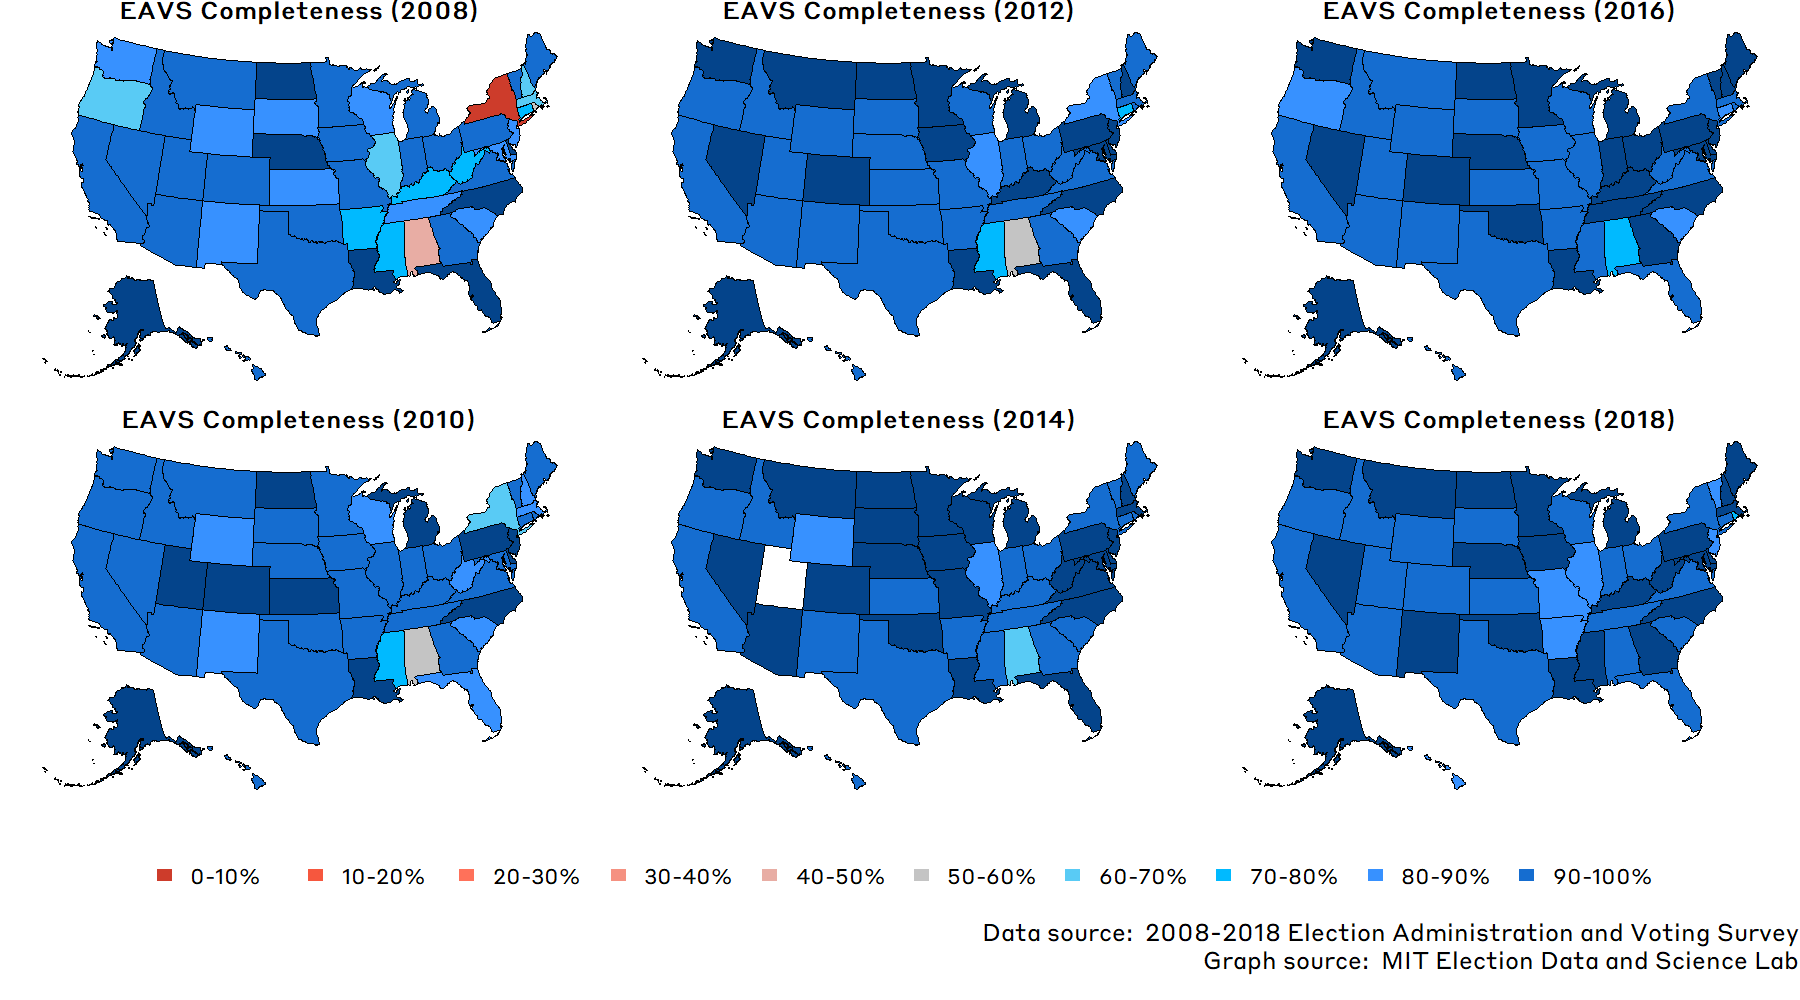
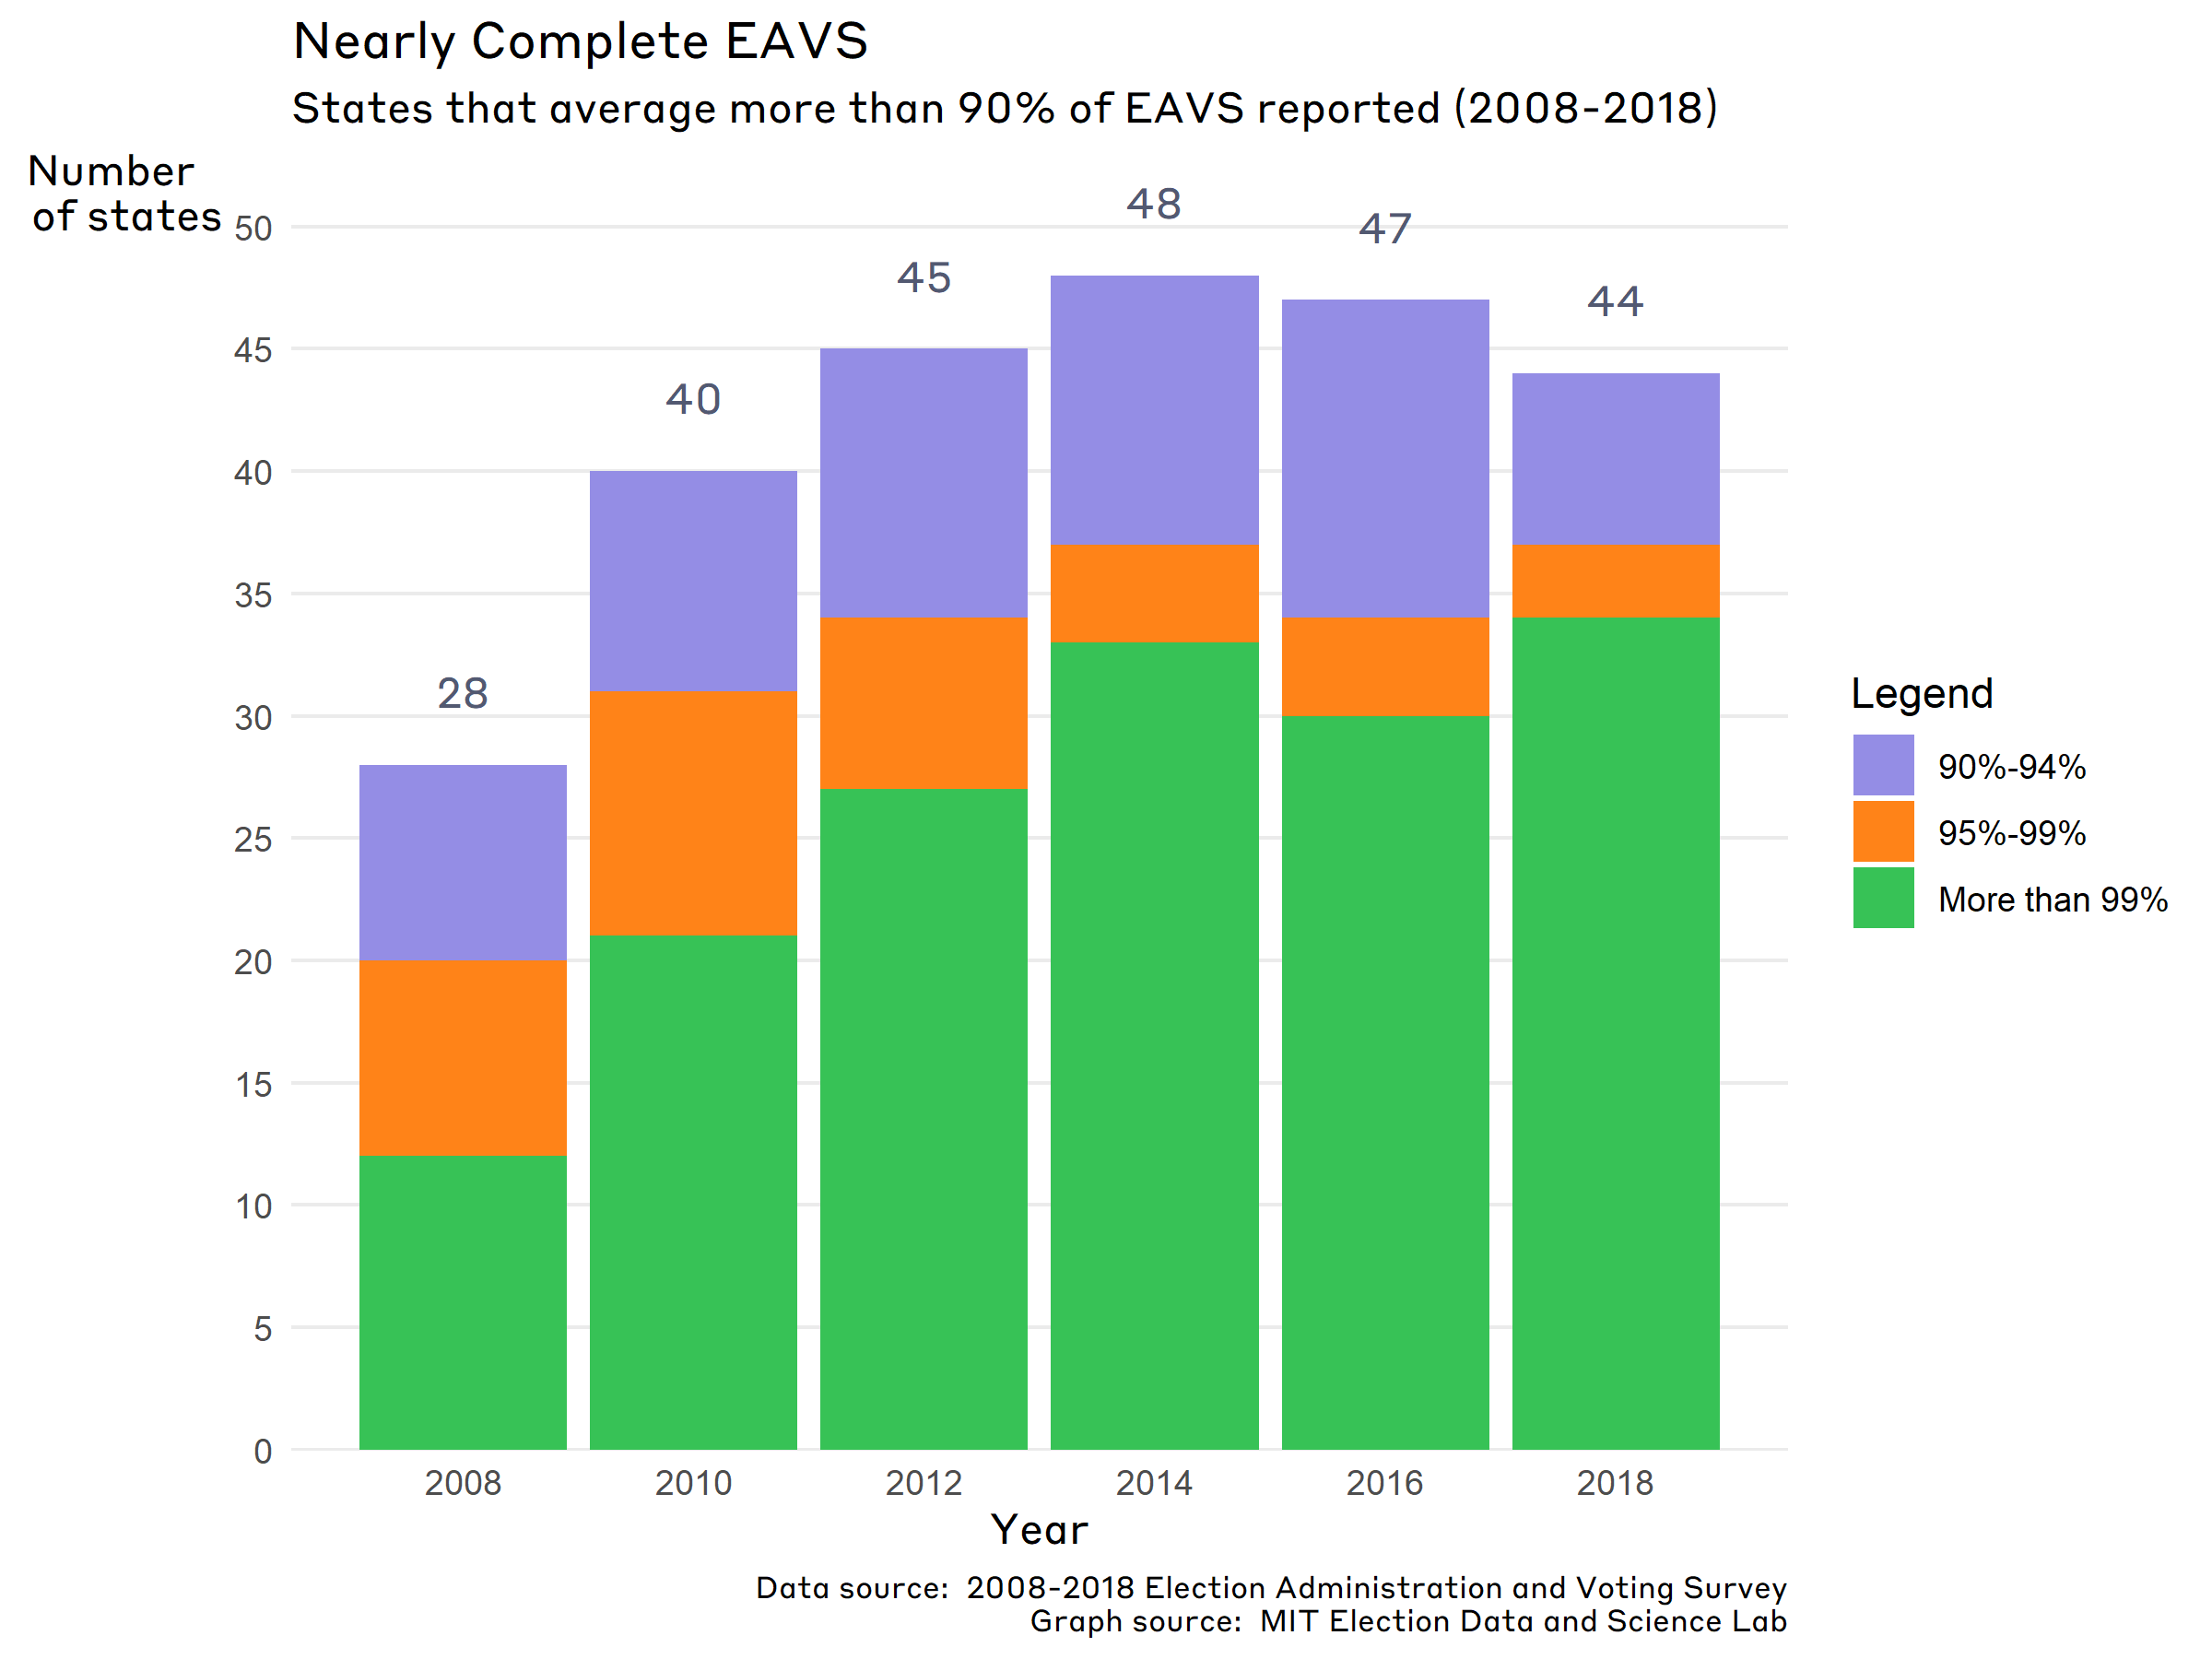
As we can see in the graphic above, while the upper bound of completeness scores has always been at 100%, the lowest scores have risen dramatically, from 0% to a whopping 76%. From 2008 to 2014, the average completeness rate of the 18 EAVS items has risen in each successive release of the EPI, from an average of 86 percent in 2008 to 97 percent in 2014. Since then, the average completeness rate has remained stable. As the series of maps below illustrate in another way, we have moved a long way from 2008, when quite a few states came up significantly short in reporting EAVS data, to 2018, when 44 states reported at least 90% of the core EAVS data.

So, how about data completeness in 2018?
Overall, the average data completeness rate stayed the same in 2018 compared to 2014, at an average score of 97%. The biggest jump in completeness scores between 2014 and 2018 occurred for Alabama, which went from reporting 63% of all items to nearly 100%. The largest drops, on the other hand, were found in New Jersey and Rhode Island, which saw drops of 17 and 18 percentage points in completeness scores, respectively. (We are currently in the middle of verifying the EAVS data with the states, so some of these statistics may change, probably for the better.)

Because state completeness scores started at a much lower point in 2008, the biggest increases in scores occurred through 2014; at that point, all but three states reported more than 90% of the core EAVS data. In 2018, a majority of the states reporting above the 90% rate are actually reporting more than 99% of the data requested — 31 states and the District of Columbia reported over 99% of the 2018 EAVS data, which is 20 more than in 2008, the first year of the EPI.
RELATED CONTENT: County Judge Orders 200,000 Names Stricken from Wisconsin Voter Rolls

Measuring completeness
Central to the data completeness measure is gauging the degree to which states report to the public basic data about the work that goes into running elections.
The completeness indicator starts with 15 EAVS items that are so basic to election administration that all jurisdictions should be expected to report them. They are akin to measures like graduation rates, murder rates, and infant mortality rates for education, crime, and public health policy.
These core items are:
- New registrations received
- New valid registrations received
- Total registered voters
- Provisional ballots submitted
- Provisional ballots rejected
- Total ballots cast in the election
- Ballots cast in person on Election Day
- Ballots cast in early voting centers
- Ballots cast absentee
- Civilian absentee ballots transmitted to voters
- Civilian absentee ballots returned for counting
- Civilian absentee ballots accepted for counting
- UOCAVA ballots transmitted to voters
- UOCAVA ballots returned for counting
- UOCAVA ballots counted.
Added to these 15 basic measures are three that help construct indicators used in the EPI: invalid or rejected registration applications, absentee ballots rejected, and UOCAVA ballots rejected.
Our analysis looks at these data by local jurisdiction; for each, the 18 indicators are assigned either a 1 (reported) or a 0 (did not report), added up, and divided by 18. The indicators are then weighed according to the size of the jurisdiction, and aggregated to the state level. Through this process, we get an idea of how much election administration data is available for the average registered voter within a state.
It’s important to note that some states are not required to report some measures that are in the EAVS. North Dakota, for example, does not have voter registration — so they don’t need to report any of the data on voter registration (ruling out items 1, 2, and 3 on the list above, as well as the measure on invalid or rejected registration applications). Additionally, not requiring voter registration means they have no reason to use provisional ballots (items 4 and 5 above), which means that their completeness score is actually divided by a denominator of 12, instead of 18. Other common exclusions for this analysis include states that are exempt from HAVA requirements on provisional ballots, or states without early voting.
Data completeness is a crucial part of our ability to understand other indicators and the quality of data available to the EPI. While the scores for this indicator have been stable in recent years, even small improvements in reporting from low scoring states helps the quality of the EPI — and help the scores of states in the overall EPI ranking. Although a few states have jurisdictions that struggle to report some data, most states and jurisdictions are taking full advantage of the EAVS and enhancing the transparency of election administration overall.
Jack Williams is a Senior Research Associate at the MIT Election Data & Science Lab.
| Website


